
Software
State-of-the-art analysis methods behind interfaces where results are never more than a few clicks away.
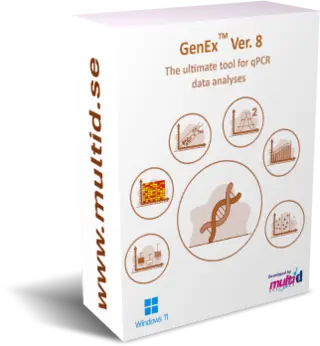
GenEx 8
Gene expression analysis for qPCR and dPCR
GenEx is our software for processing and analysing gene expression data, used in biological research and in the pharmaceutical and diagnostics industries.
It covers everything from preprocessing, assay validation and data management to advanced analysis: assay performance (limit of detection, limit of quantification, dynamic range, efficiency), reference gene selection and validation, sample classification, identification of differentially expressed genes and monitoring of time-dependent processes.
-
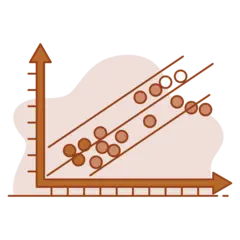
Scatter plot
Plot any two variables against each other with regression lines and confidence bands.
-
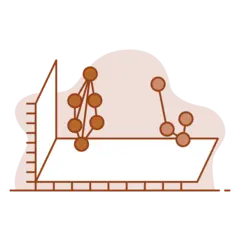
Dynamic PCA
Rotate principal component plots in 3D to see how samples and genes group.
-
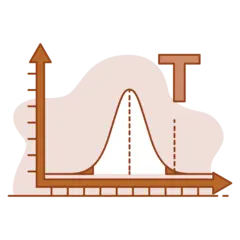
t-test
Compare two groups gene by gene with correction for multiple testing.
-
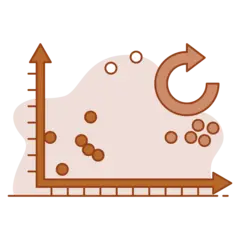
Varimax rotation
Rotate factor solutions so each factor is easier to interpret.
-
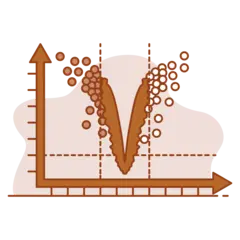
Volcano plot
See fold change and significance together to spot the genes that matter.
-

Self-organising maps
Group samples or genes with similar profiles using Kohonen networks.
-
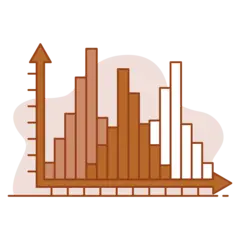
Multi-histogram
Compare distributions across many genes or groups at once.
-

NormFinder
Rank candidate reference genes by expression stability.
-
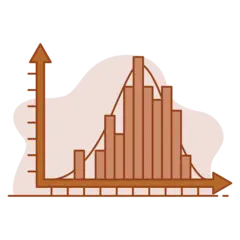
Uniformity test
Check whether data follow the expected distribution before testing.
-

Box plot
Summarise spread and outliers for each gene and group.
-
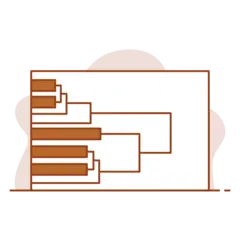
Dendrogram
Hierarchical clustering of samples and genes.
-

Descriptive statistics
Means, standard deviations and confidence intervals at a glance.
-

geNorm
Determine the optimal number of reference genes.
-

Heat map
Clustered expression heat maps with dendrograms on both axes.
GenEx GxP
qPCR and dPCR analysis for regulated labs
GenEx GxP is built for bioanalytical and diagnostic laboratories that run qPCR and dPCR in regulated workflows, with secure data handling, traceability and encryption.
Characterise standard curves, dynamic range, PCR efficiency, limits of detection and quantification, and precision. Use quality controls to validate performance and estimate concentrations of test samples. Every performance parameter is reported with confidence ranges, in line with regulatory requirements and guidelines.
-
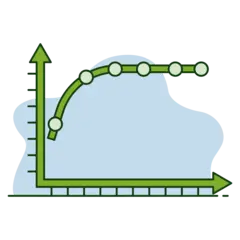
Limit of detection
Estimate the lowest concentration that can be reliably detected.
-
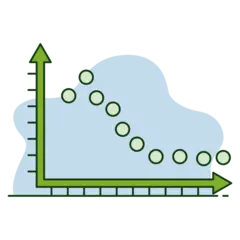
Limit of quantification
Find the lowest concentration that can be measured with acceptable precision.
-
Reverse calibration
Estimate unknown concentrations from the standard curve with confidence ranges.
-
Standard curve
Fit standard curves and derive efficiency and dynamic range.
-
Standard curve QC
Check linearity and flag deviating standards.
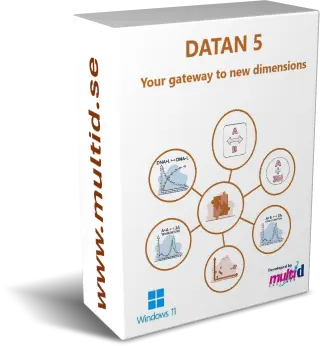
DATAN 5
Chemical equilibria from spectroscopic data
DATAN makes it easy to characterise chemical equilibria and reactions by using entire spectra and higher-order experimental data. Behind a simple interface, state-of-the-art algorithms – several of them developed by MultiD – extract chemical information with minimal assumptions.
From the experimental data alone, DATAN determines the number of components in the samples, their spectra and concentrations, and equilibrium constants with related thermodynamic parameters.
-
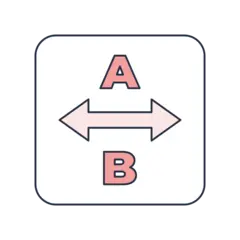
Isomerisation
A ⇄ B equilibria resolved from spectral series.
-
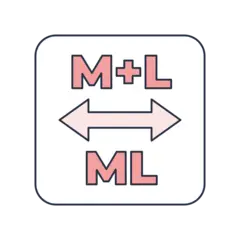
Complexation
Metal–ligand complex formation and stability constants.
-
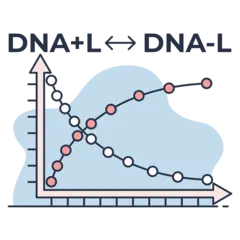
DNA–ligand binding
Binding constants for ligands interacting with DNA.
-
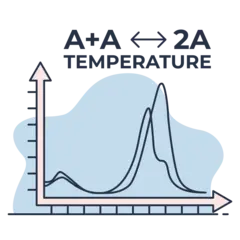
Oligomerisation, temperature
Dimerisation followed as a function of temperature.
-
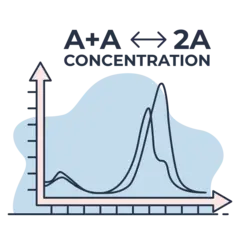
Oligomerisation, concentration
Dimerisation followed as a function of concentration.
-
PLS
Partial least squares regression for calibration and prediction.
-

Protolysis, one step
Acidity constant for a single protonation step.
-

Protolysis, two steps
Acidity constants for two protonation steps.
-

Protolysis, three steps
Acidity constants for three protonation steps.
-
PCA
Principal component analysis to find the number of components.
Support and training
-
Technical support
Free help with installation, licence activation, licence transfer and more.
-
Application support
Confidential online help with your own data. A typical case takes 30 minutes to 2 hours and is invoiced per 30-minute interval.
-
Courses
We put together a course that suits your needs. Ask about a course.